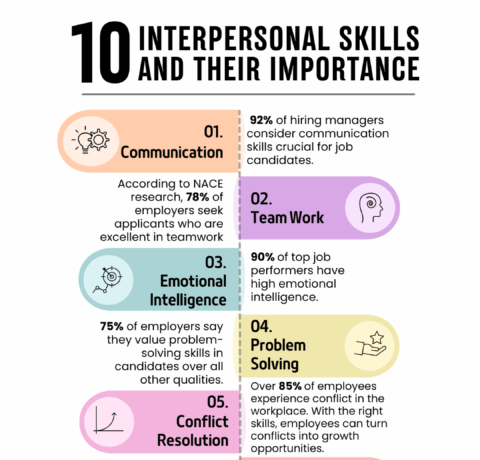
The Power Of Data Visualization: Turning Complex Data Into Meaningful Insights—Infographic
Data visualization is the process of presenting complex data in visual formats such as charts, graphs, and dashboards to make information more accessible and understandable. By turning raw data into meaningful visuals, businesses can quickly identify trends, patterns, and insights that drive better decision-making. With customized dashboards and real-time analytics, companies can monitor key performance indicators and make data-driven strategies efficiently. There are also consulting services that help design tailored solutions for integrating diverse data sources into user-friendly displays, ensuring clear communication across teams and stakeholders. This approach enhances productivity and supports smarter business decisions in a dynamic market landscape.


You can adjust your cookie preferences here.